
The Asset Mix widget shows you how holdings within a portfolio are divided. The widget groups a portfolio’s open (bought, but not fully sold) holdings into different classes to sum up the total market value (Market value + Accrued) of those holdings and calculate what percentage of the portfolio each class makes up at the As of Date set in the Date Selector. You can view the market value and accrued income calculation on a tooltip by hovering over the value.
Note: The Date Selector, near the top of the page, is where you set the dates and interval that the widgets in each Workspace and the tools on other pages in the app operate around.
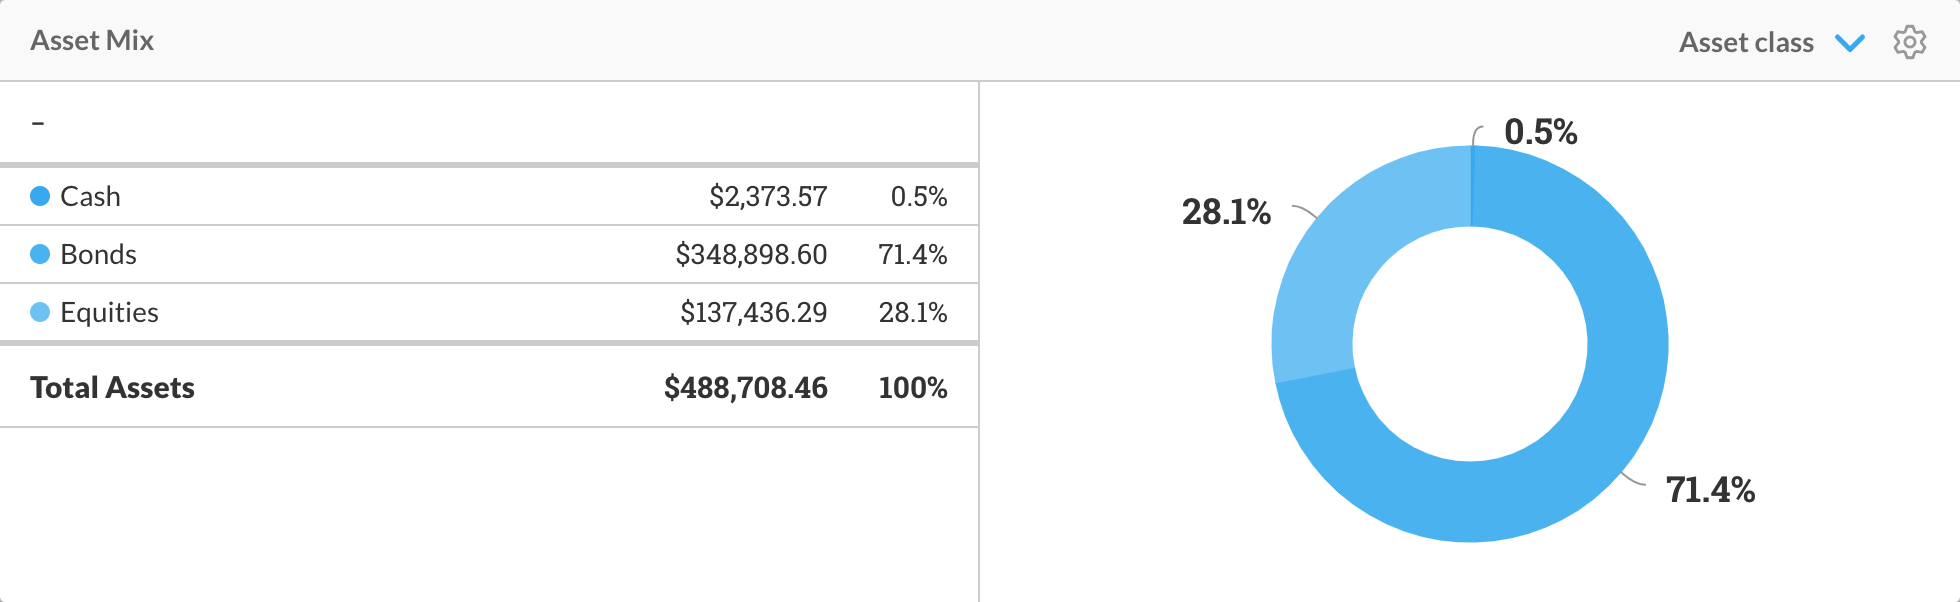
Those classes, their total market value, and their weight in a portfolio are displayed in a table and a pie chart.
The table includes the name of the account you are viewing as well as the total market value and weight in percentage of each class the account’s holdings fall under. You can hover over each class in the table to highlight the corresponding section in the chart. Beneath the table of classes is the sum of the total market value of all assets, which always has a total weight of 100% as it represents all of the holdings in a portfolio.
The pie chart displays the weight of different classes in sections. Each section of the chart is coloured differently (as determined by an Advisor), so you can easily tell them apart, and each section is labelled with its class’s weight in percentage. You can hover over each section to reveal which class that section represents and highlight the corresponding entry in the table. You can also click a section to separate it from the rest of the chart and get a sense of how much of a portfolio that class makes up.
Note: Since the Asset Mix widget only displays the value and weight of open holdings, if a portfolio has no open holdings at the set As of Date the widget displays a message saying so.