
The Growth Against Contributions widget shows you how the net contributions (deposits minus withdrawals) made to a portfolio compare to the changing total market value (market value + accrued) of that portfolio’s holdings over the date range set in the Date Selector.
Note: The Date Selector, near the top of the page, is where you set the dates and interval that the widgets in each Workspace and the tools on other pages in the app operate around.
This allows you to see, at a glance, if the investments in an account’s portfolio resulted in an unrealized profit or loss during the date range set.
Understanding the Chart
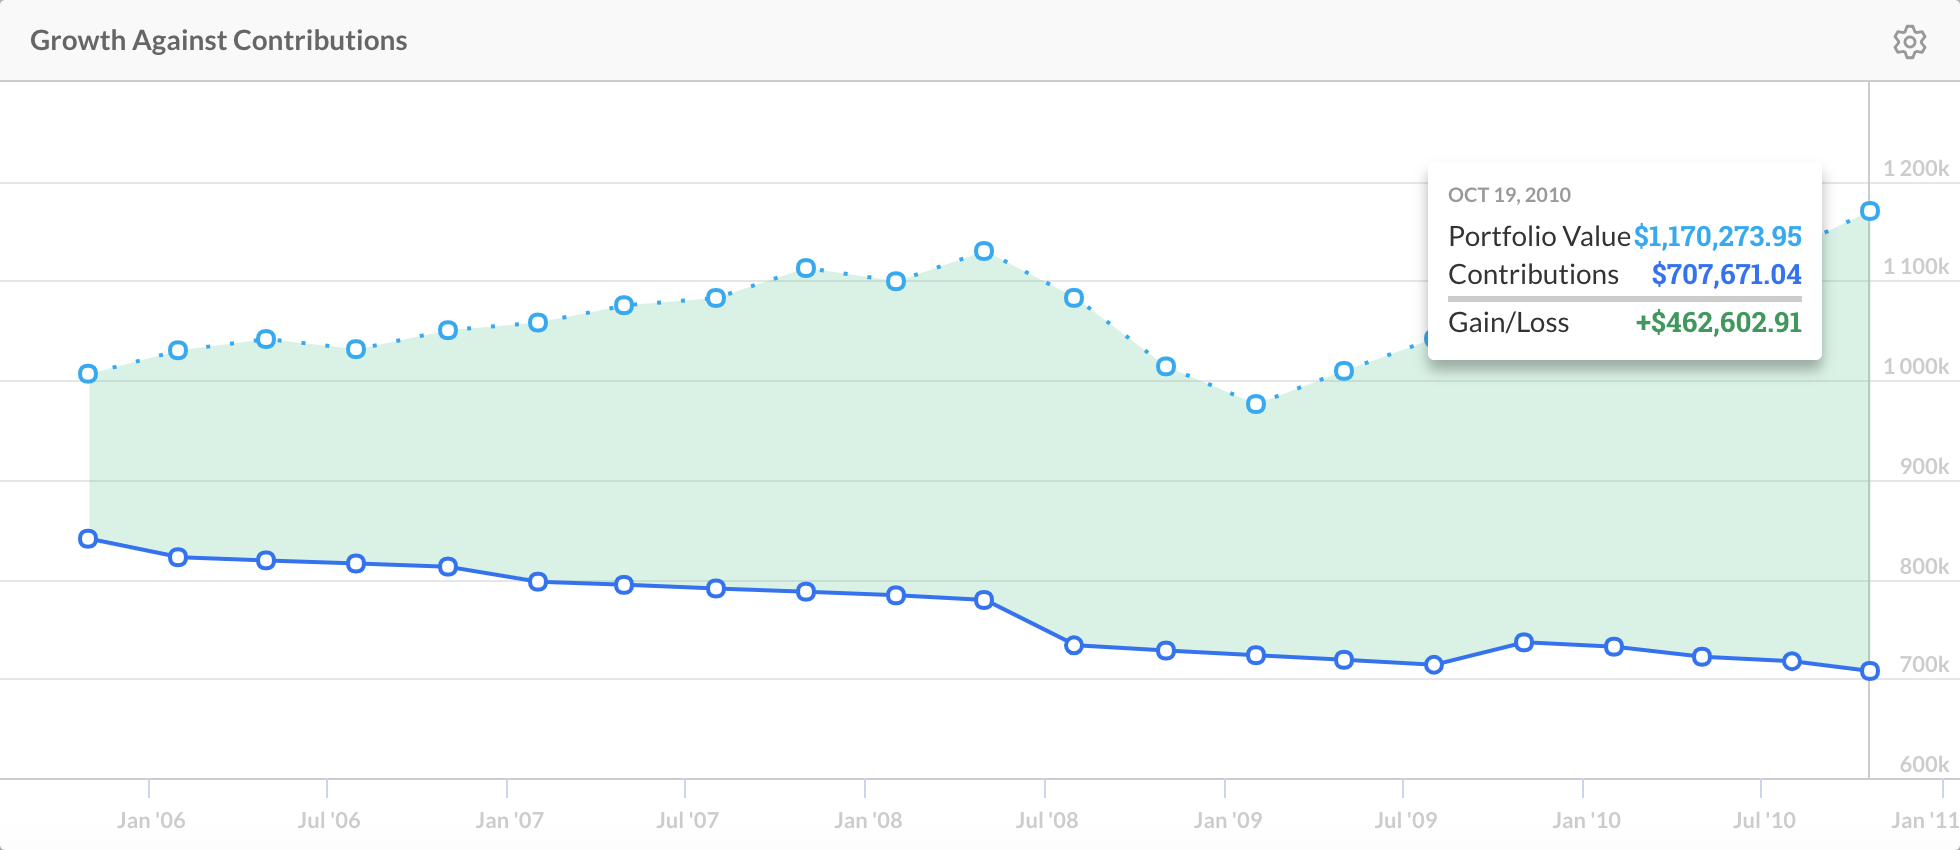
The widget is a chart comparing two separate lines. A solid line represents the net contributions to a portfolio, and a dotted line represents the total market value of that portfolio’s holdings. The dotted line is used in contrast to the solid line, signifying that the total market value is unrealized.
Both lines share a horizontal and vertical axis. The horizontal axis measures the time passed within the date range set. The axis is labelled with dates based on the size of the date range set in the Date Selector (e.g. setting a Monthly interval creates labels for every month in a date range unless the date range involves too many months, in which case a more suitable number of months are labelled for ease of reading).
The vertical axis measures the value of the net contributions and holdings. The intervals on this axis are always set to best fit the value of a portfolio’s holdings.
The two lines on the chart also coordinate to indicate an unrealized gain or loss (profits or losses that would occur if all holdings in a portfolio were sold at a certain time). An unrealized profit is apparent when:
-
The dotted line is above the solid line
-
The area between the two lines is shaded green
And an unrealized loss is apparent when:
-
The dotted line is below the solid line
-
The area between the two lines is shaded red
As a result of how these lines are plotted, the size of the shaded areas is directly proportional to the amount of unrealized profit or loss that would occur. This helps you see how much of an unrealized profit or loss occurred at a given time.