The Performance Comparison widget depicts gaps in a portfolio – periods where a portfolio has no holdings or has no data to report (due to transaction information being temporarily unavailable) – as shaded grey areas on the graph. Gaps begin at a point where a portfolio has no holdings and end at a point where a portfolio gains at least one new holding or when performance data becomes available.
Gaps only appear in the widget’s graph when the date range set in the widget includes a gap period before or after periods where a portfolio’s performance was recorded (see Figure 3). If a gap takes up the entire date range set, the widget displays a message prompting you to set a new range where there is performance to report.
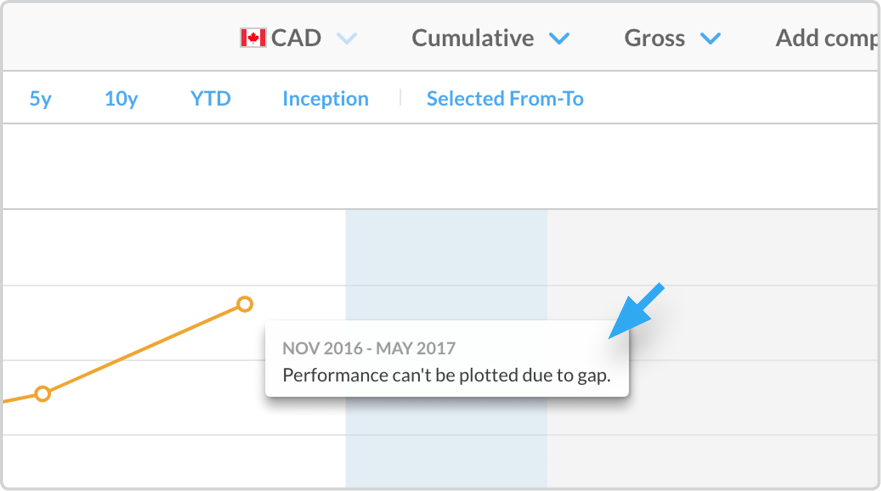
Figure 3 - Gap after periods where a portfolio’s performance was recorded
The widget also depicts gaps in a comparable item’s performance by excluding a segment of the line which represents that item’s cumulative performance and by excluding a bar representing that item’s periodic performance.